Comprehensive Guide to eBPF: From Basics to Advanced Usage
Part 1: Introduction to eBPF
What Is eBPF?
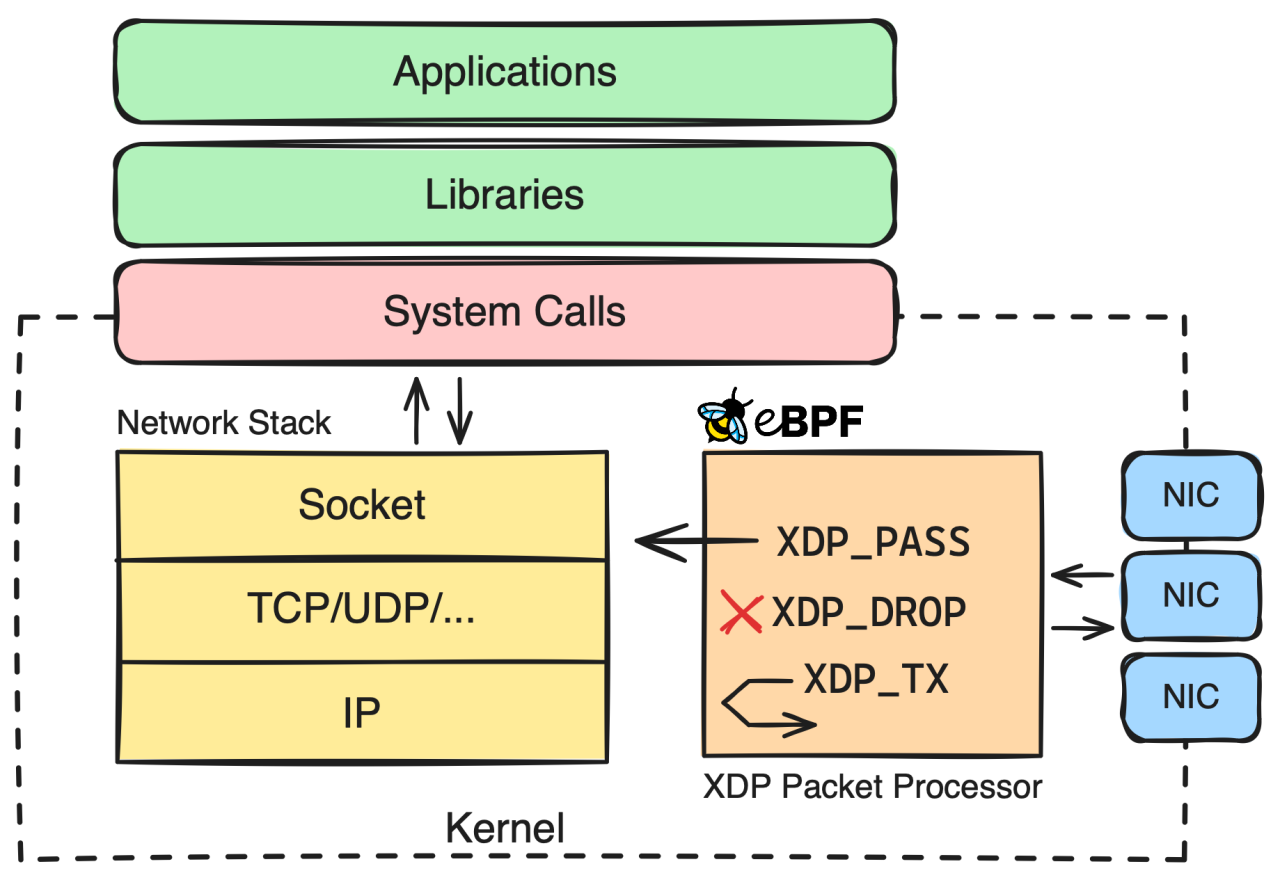
eBPF (extended Berkeley Packet Filter) is a groundbreaking technology in the Linux kernel that lets you run small, sandboxed programs in response to events in the kernel. Historically, BPF was used for filtering network packets, but eBPF expanded those capabilities significantly. Now you can attach eBPF programs to a wide range of events—system calls, function entry/exit, kernel tracepoints, user-level function calls, network events, and more—without modifying or recompiling the kernel.
Why Use eBPF?
- Observability
Gain deep insight into system behavior (CPU usage, memory, network) by hooking into kernel functions. - Networking
Perform high-performance packet filtering or load balancing without the overhead of context switching to user space. - Security
Detect security anomalies (e.g., unauthorized file access) in real time. - Performance
Debug performance bottlenecks by tracing function calls, latencies, and more.
Key Benefits
- Safe Kernel Access: eBPF code runs in a sandbox, ensuring the system doesn't crash or hang.
- Dynamic Updates: You can load/unload eBPF programs at runtime.
- Flexibility: Attach to various hook points and handle events in real time.
- No Kernel Reboots: No need for custom kernel modules or reboots.
Part 2: Core Concepts and Architecture
Core Components
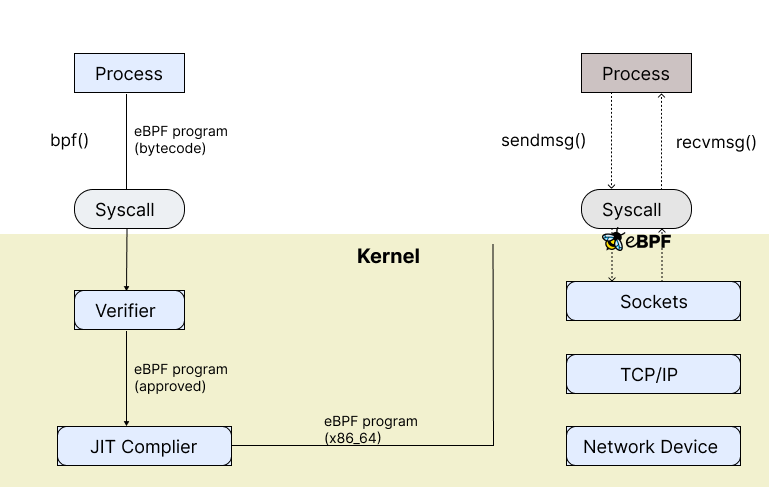
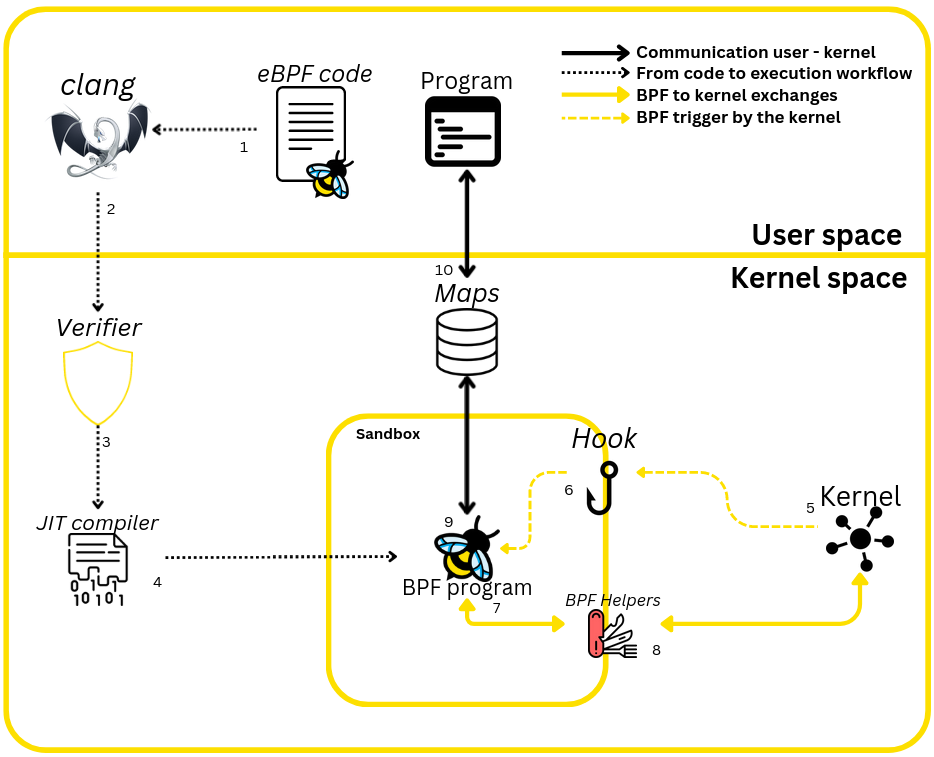
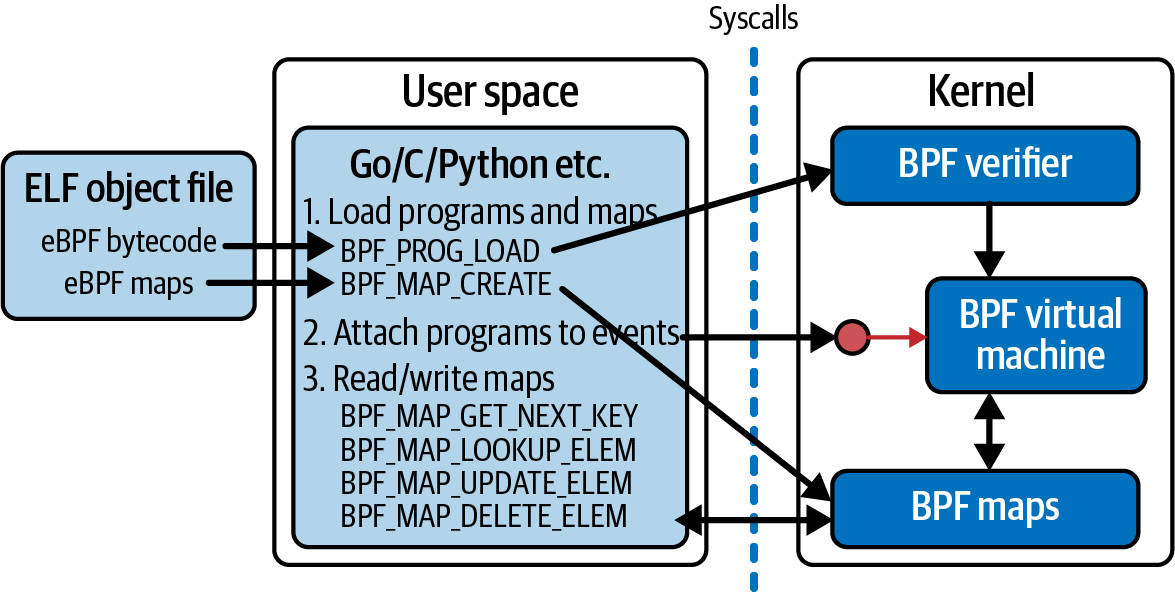
- Programs: Written in a restricted version of C (sometimes with higher-level wrappers) and compiled to eBPF bytecode.
- Verifier: Checks your program for safety (no unbounded loops, valid memory access, etc.).
- JIT Compiler: Converts the bytecode into native machine instructions for efficiency.
- Maps: Special data structures for sharing data between user space and the kernel (e.g., hash maps, arrays, perf buffers).
Typical Workflow
- Write code in C (or Go with eBPF tooling)
- Use clang or a specialized library to compile your eBPF code into bytecode.
- Load the bytecode into the kernel via a user-space program (using a library like libbpf or libbpfgo).
- Attach your eBPF program to the desired hook (system call, kprobe, tracepoint, etc.).
- Observe data or enforce policies in real time!
eBPF vs. Traditional Kernel Modules
- Security: eBPF is sandboxed, so you can't accidentally crash the kernel.
- No Reboots Required: Dynamically load and unload programs.
- Lightweight: eBPF uses the JIT approach, so performance overhead is minimal.
Part 3: Historical Context and Evolution
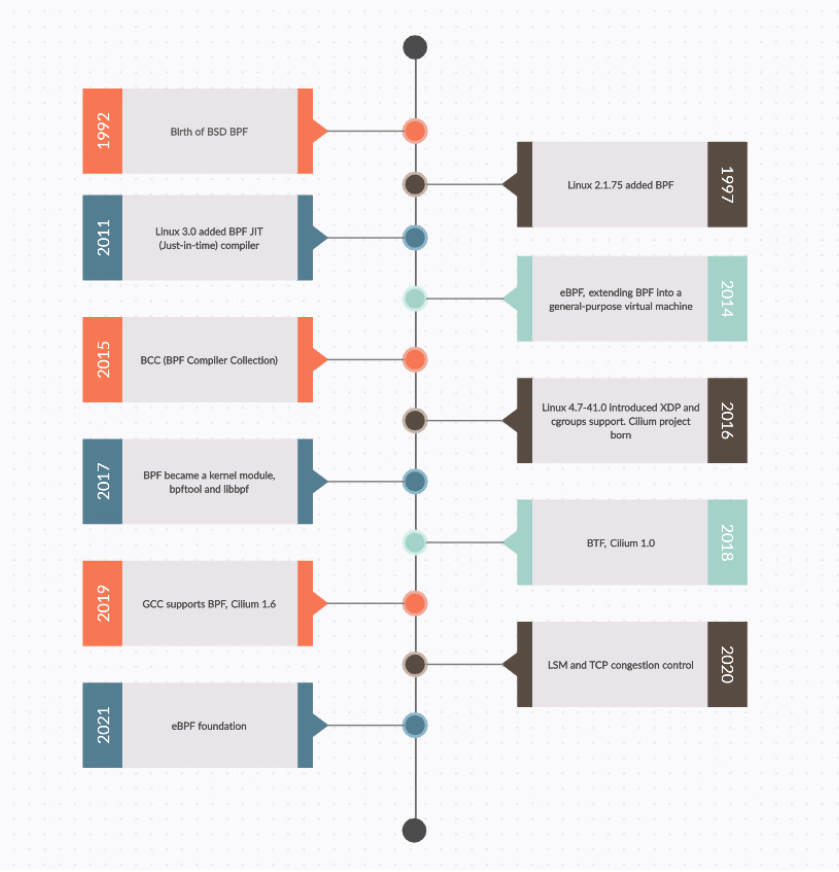
- BPF Origins: Initially developed for network packet filtering (tcpdump uses classic BPF).
- 2014: Linux 3.18 introduced eBPF with limited functionality.
- 2016: Linux 4.4 brought a more complete eBPF feature set.
- Today: eBPF is used in many high-profile projects (e.g., Cilium for networking, Tracy for runtime security and observability).
Part 4: A Simple "Hello World" Example
Let's walk through a minimal example. This will demonstrate how eBPF programs are loaded and how they communicate with user space.
Note: You'll need a recent Linux kernel (4.4 or above) and development tools like clang, llvm, and libbpf-dev (or a Go toolchain with libbpfgo bindings).
Step 1: The eBPF Program (C Code)
Create a file called hello_bpf.c:
#include <linux/bpf.h>
#include <bpf/bpf_helpers.h>

// This macro defines our license. Required by the verifier.
char LICENSE[] SEC("license") = "GPL";

// eBPF program to run on some hook. For demonstration, it's just a no-op.
SEC("tracepoint/syscalls/sys_enter_execve")
int hello_world(void *ctx)
{
    bpf_printk("Hello from eBPF!\n");
    return 0;
}
Step 2: Compile the eBPF Program
clang -O2 -g -target bpf -c hello_bpf.c -o hello_bpf.oStep 3: Create a User-Space Loader (C or Go)
Example in C using libbpf:
#include <stdio.h>
#include <bpf/libbpf.h>
#include <bpf/bpf.h>
#include <errno.h>

int main(int argc, char **argv) {
    struct bpf_object *obj;
    int err;

    // Open the eBPF object file
    obj = bpf_object__open_file("hello_bpf.o", NULL);
    if (libbpf_get_error(obj)) {
        fprintf(stderr, "Error opening BPF object file\n");
        return 1;
    }

    // Load into kernel
    err = bpf_object__load(obj);
    if (err) {
        fprintf(stderr, "Error loading BPF object: %d\n", err);
        return 1;
    }

    // Attach all programs in the object (e.g., the tracepoint)
    err = bpf_object__attach_skeleton(obj);
    if (err) {
        fprintf(stderr, "Error attaching BPF program: %d\n", err);
        return 1;
    }

    printf("eBPF program successfully loaded and attached!\n");
    // Keep the program running so we can see the trace messages
    while (1) {
        sleep(1);
    }
    return 0;
}
Example in Go with libbpfgo (simplified snippet):
package main

import (
    "fmt"
    "time"
    libbpf "github.com/aquasecurity/libbpfgo"
)

func main() {
    // Load the eBPF object
    bpfModule, err := libbpf.NewModuleFromFile("hello_bpf.o")
    if err != nil {
        panic(err)
    }
    defer bpfModule.Close()

    // Load and verify
    if err := bpfModule.BPFLoadObject(); err != nil {
        panic(err)
    }

    // Attach the program (tracepoint)
    prog, err := bpfModule.GetProgram("hello_world")
    if err != nil {
        panic(err)
    }
    _, err = prog.AttachTracepoint("syscalls", "sys_enter_execve")
    if err != nil {
        panic(err)
    }

    fmt.Println("eBPF program loaded and attached. Press Ctrl+C to exit.")

    for {
        time.Sleep(time.Second)
    }
}
Step 4: Run and Check Logs
- Open a terminal to watch kernel trace output:
sudo cat /sys/kernel/debug/tracing/trace_pipe - In another terminal, run your loader (C or Go).
- Execute any command (e.g., ls, pwd), and you should see Hello from eBPF! appear in your trace window.
Congratulations! You've just run your first eBPF program.
Part 5: Attaching to More Hooks: kprobes, uprobes, and More
Types of eBPF Hooks
- Kprobes and Kretprobes:
- Use Case: Debugging and understanding kernel-level behavior without modifying the kernel code.
- Example: Monitoring a system call's arguments and return values.
- Tracepoints:
- Use Case: Observability and diagnostics, leveraging stable points in the kernel.
- Example: Tracking the scheduler or block I/O operations.
- Uprobes and Uretprobes:
- Use Case: Analyzing user-space application behavior.
- Example: Profiling the performance of a database query function.
- Socket Filters:
- Use Case: Capturing and analyzing traffic at the socket level.
- Example: Implementing a custom packet filter for a specific application.
- Traffic Control (tc) Hooks:
- Use Case: Controlling and shaping traffic at the network device level.
- Example: Prioritizing traffic for specific applications or enforcing bandwidth limits.
- XDP (eXpress Data Path):
- Use Case: High-speed packet processing directly in the NIC driver.
- Example: Dropping malicious packets before they reach the TCP/IP stack.
- LSM (Linux Security Modules) Hooks:
- Use Case: Enforcing security policies without modifying the kernel or using traditional LSMs like SELinux or AppArmor.
- Example: Restricting file access for certain processes dynamically.
- Raw Tracepoints:
- Use Case: Gaining access to critical kernel execution points with minimal overhead.
- Example: Profiling lock contention or memory allocation latency.
- Perf Events:
- Use Case: Monitoring system performance metrics.
- Example: Counting cache misses or measuring CPU cycles consumed by a process.
kprobes and uprobes
- kprobes allow you to attach eBPF programs to kernel functions.
- uprobes allow you to attach eBPF programs to user-space application functions.
Example: Suppose you want to trace every time a user-space function main in my_app is called. You can attach a uprobe on main:
sudo perf probe -x /path/to/my_app mainThen modify your eBPF C code to attach:
SEC("uprobe/my_app/main")
int trace_my_app_main(struct pt_regs *ctx)
{
    bpf_printk("my_app's main function is called!\n");
    return 0;
}
Perf Buffers and Maps
You often need to share data between your eBPF code and user space. That's where maps come in. Maps can be hash maps, arrays, LRU maps, ring buffers, and more. perf_event_array is a special map used for streaming arbitrary data.
For more information about eBPF maps and data flow, see:
Part 6: Real-World Use Cases and Projects
Observability with Tracy
Tracy is a project leveraging eBPF to trace system calls and events in real time for security and observability. It attaches eBPF programs to various syscalls and collects data in user space, providing insights into what's happening at the kernel level.
Network Filtering with Cilium
Cilium uses eBPF to enhance container networking in Kubernetes. It attaches to network events to perform high-speed packet routing and security filtering without user-space overhead.
For real-world examples and applications, check out these projects:
- Cilium - Container Networking
- Tracee - Runtime Security and Forensics
- BCC (BPF Compiler Collection) - Tools for BPF-based Linux IO analysis, networking, monitoring, and more
Security Monitoring
Many security tools use eBPF to track file access, process behavior, and network connections. Because eBPF runs in the kernel, these tools can detect anomalies in near real time.
Part 7: Summary of Conference Videos
1. Beginner's Guide to eBPF Programming with Go
- Describes eBPF as a way to "insert" custom code into the kernel dynamically.
- Explains that both original BPF and eBPF go through a verification step for safety.
- Shows an example of how a user-space Go program uses libbpfgo to load and manage eBPF objects.
- Introduces how to attach to different events (kprobes, uprobes, tracepoints, etc.).
2. Advanced eBPF Usage
- Demonstrates how eBPF makes the kernel programmable for custom tasks.
- Shows a "Hello World" example, covering the lifecycle of the code from C source to loaded kernel bytecode.
- Explains the role of maps (like perf_event_array) to share data between kernel and user space.
- Emphasizes that you can attach eBPF programs to kernel or user-level functions with kprobes and uprobes.
Part 8: Where To Go From Here
- Dive Deeper into BPF Maps
Learn about map types like hash maps, LRU maps, and ring buffers for advanced data sharing. - Explore Additional Hooks
- Tracepoints for kernel-level instrumentation.
- kretprobes for function return tracing.
- XDP for high-speed packet processing.
- Try Out Real Tools
Use existing projects (e.g., BCC, bpftrace) that provide simpler abstractions over raw eBPF development. - Contribute
The eBPF ecosystem is active. Contribute to libbpf, libbpfgo, or build your own project to help the community. - Stay Updated
eBPF is evolving fast. New kernel versions and libraries introduce more features and improved verifier logic.
Final Thoughts
eBPF represents a massive leap in how developers interact with the Linux kernel—without the risks and friction of traditional kernel modules. By following the examples above, you can begin experimenting with eBPF programs yourself, attaching them to various events (syscalls, kprobes, tracepoints) for advanced observability, networking, and security use cases.
From simple "Hello World" programs to full-fledged security and monitoring tools, eBPF is an incredibly powerful (and safe) way to harness kernel power. Happy hacking!